Examples for the use of winLIFE
Examples from the automotive industry show the wide range of applications for winLIFE:
- Automotive engineering
- Aircraft construction
- Wind energy technology
- Welding engineering
- Universities
Automotive Industry
Many winLIFE users come from the automotive industry. Two examples from the powertrain and axle sectors illustrate this:
Powertrain
Clutches, torque converters, retarders, gearbox housings, shafts, planetary gears, torsion dampers, trucks and agricultural vehicles.
Measurements were carried out on real tracks to capture real-world conditions. A race track, the Nürburgring, was measured in detail and used as a basis for durability tests, particularly for the powertrain and automatic transmission.

The load spectrum measured at the Nürburgring for a Mercedes S 500 with the 7-speed automatic transmission illustrated is shown in the following figure.


AXLE SUSPENSIONS
winLIFE is used in the development of military vehicles. Chassis, axles and springs were calculated with winLIFE. During the road test, measurements were taken on different road categories to determine the particularities caused by road unevenness.


FE model of a rim with unit loads for vertical force and wheel hub, which was used as the basis for calculating the fatigue life of the Fennek wheel hub under the influence of the load data measured in the road test (3 forces, 3 moments) using the rotating superposition


Aircraft Applications
Manoeuvring aircraft at an airport is more economical when done by a tow truck. The tow tractor pulls the aircraft with a rod on the front landing gear. The question arose as to what loads would occur compared to normal flight operations and whether this could lead to a fatigue problem.
Strain gauges were attached to the landing gear and measured during manoeuvring and landing. A comparative fatigue life calculation showed the damage caused by the landing and manoeuvring processes and allowed an assessment to be made.


As a result, it was possible to assess the relationship between the damage caused by the landing and the manoeuvring with the tow tractor. These processes on the ground can now be taken into account in the overall load on the landing gear.
Wind Turbines
When designing a wind turbine, the fatigue life must be verified using mathematical methods. Wind turbines are designed to last for decades and must be able to withstand strongly changing weather conditions. The towers, rotor hub and components of the wind turbine are calculated in this way.
Offshore turbines, which are located off the coast and are exposed to extreme conditions such as waves, wind and salt water, are subject to even stricter requirements.
To make the work of wind turbine manufacturers easier, calculation rules are integrated, e.g. for generating S-N curves in accordance with the regulations of Germanischer Lloyd. The following figure shows a wind turbine planet carrier calculated with FEMAP and winLIFE.


The following figure shows results for a gearbox-housing from Zollern Company, which was calculated with ANSYS and winLIFE (damage is shown).

Weld Seam Calculation
Hot-Spot Search (Example from Shipbuilding)
The main feature of this method is that, in the case of welded sheets made up of plate elements, the elements are found largely automatically at the plate joints, where the welds are usually located. The element stresses projected perpendicular to the weld notch are used for the fatigue life calculation. As only one element is used for the fatigue life prediction, the weld notch stress is not realistically captured and the prediction quality is poorer than the structural stress concept. However, this method also finds the critical points of a structure. If necessary, the hotspots found can then be recalculated using the structural stress concept to improve the prediction quality.


NOTCH STRESS CONCEPT R1 (SEMITRAILER AXLE)
The welded joint of the rear axle of a semi-trailer was calculated using FEMAP (Fig.). The substructure method was used, in which the relatively coarsely modelled overall model was calculated first. The welds were then "cut out" and modelled very finely according to the specifications of the r1 concept (Figure).
A fatigue life calculation was then performed for the weld only, based on the acting load spectrum. This enabled the critical crack locations to be identified in accordance with the test results and a fatigue life estimate to be calculated and compared for the conditions on the test track and for a real customer collective. The results were very helpful in the development of this axle.


STRUCTURAL STRESS CONCEPT (EXAMPLE: UNIMOG TRAILER COUPLING)
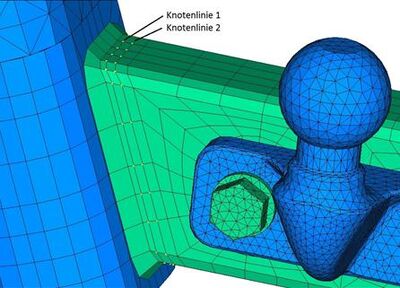
The weld seams for the ball head hitch shown are to be calculated according to the structural stress concept. In this example, only the fillet welds on the left-hand side between the U-profile and the rectangular profile are considered, see Fig. 1-1.

The model is mainly composed of tetrahedral elements. The areas of the weld seams to be analysed are meshed with hexahedral elements. For the structural stress concept with linear extrapolation, defined distances of the node rows from the fillet weld are maintained, as shown by the nodes marked in yellow in the figure.
The distance of node line 1 is 0.4 x plate thickness from the weld seam and the distance of node line 2 is 1 x plate thickness from the weld seam. Therefore, with a plate thickness of the rectangular profile of 7.1 mm, node line 1 is 2.84 mm and node line 2 is 7.1 mm from the fillet weld.
The ball head is subjected to two load cases, which are initially displayed separately. In the following fatigue life calculation in winLIFE, these two load cases act simultaneously.
The ends of the U-profiles are fixed in the area of the holes.
|
Load Case No. |
Type of Load |
Load |
|
1 |
Lateral load
|
Tensile force in y-direction Fy = 20000 N
|
|
2 |
Vertical and horizontal load |
Tensile force in x direction Fx = 21700 N |
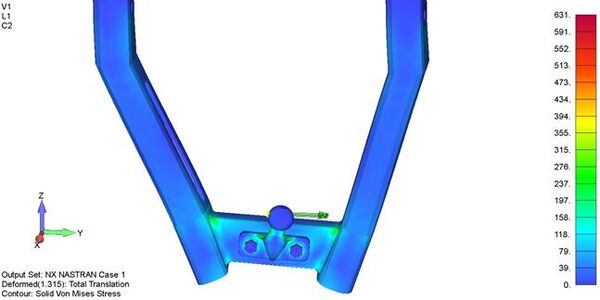

The degree of utilisation is shown in the following figure. A fatigue factor of 0.178 means that 17.8% of the fatigue limit has been used.

Combination of MBS and FEM Simulation for an Excavator Arm
To analyse the fatigue life of an excavator arm, a multi-body dynamics simulation (Recurdyn) was carried out in combination with a finite element simulation. The results of the time-dependent stresses were imported from Recurdyn and used in winLIFE for the damage accumulation calculation.

A stress-time function was determined for each node of the structure and the number of repetitions until cracking was calculated.
The variation of the acceleration during operation showed the influence of the operating conditions on the fatigue life.

Universities
winLIFE has been used in teaching and research at several universities and colleges for many years. In order to meet the requirements of a larger number of installations, a special university version has been developed. The easy handling of winLIFE enables students to quickly and independently familiarise themselves with the software. The necessary functionality is provided to clearly explain the essential calculation concepts.
The documentation, including examples, is suitable to fully understand the results, so that the student also understands in detail what he or she is working on.
The university version consists of a full version for the supervisor with a separate single user hardlock. An additional network licence for 10 users allows a slightly restricted use of winLIFE BASIC, which is completely sufficient for academic questions.


